

The single number that predicts whether a funded-account challenge is realistic is your PT:DD ratio, profit target divided by max drawdown. A ratio near 1.0 is generally balanced; push much past 1.5 and the math starts fighting you before you place a trade. Calculate yours first, then check whether the drawdown is static or trailing, because that detail changes what the ratio actually means.
TL;DR:
- A PT:DD ratio near 1.0 indicates a balanced and achievable challenge, while ratios above 1.5 require strategies with proven, consistent payoffs.
- Trailing drawdowns tighten usable risk room as the account grows, making the challenge harder compared to static, end-of-day, or balance-based measurements.
- High ratios combined with intraday, trailing, or intraday measurement styles demand extremely disciplined risk management and proven trading edges to succeed.
- Controlling risk per trade based on your worst historical streak and setting clear stop rules significantly improve survival chances during evaluation.
- Testing your sizing, stops, and rules on simulated accounts with static, balance-based drawdown models simplifies adherence and minimizes emotional mistakes.
Table of Contents
- Profit Target vs Drawdown: What Each Term Actually Means
- Calculating the PT:DD Ratio and Required R Multiple
- How Static vs Trailing Drawdown Changes the Real Difficulty
- Using PT:DD to Judge a Prop Firm Evaluation
- A Step-by-Step Plan: Targets, Position Sizing, and Kill Switches
- Worked Math: Recovery Percentages and Two Real Scenarios
- Risk Controls and Platform Choices That Match the Math
- Common Mistakes and Emotional Traps Near the Target
- Why Survival Beats Ambition Near the Target
- Testing Your PT:DD Plan on FundedAxe
- Sources
Profit Target vs Drawdown: What Each Term Actually Means
Traders throw around "profit target" and "drawdown" like they're single, fixed things. They're not. Each term splits into at least two versions, and mixing them up is how people misjudge a challenge before they've funded the account.
A profit target works on two levels. The trade-level target is the exit point on a single position, the price where you take profit and walk. The account-level target is the pass threshold a prop firm sets, typically expressed as a percentage of the starting balance, like an 8% or 10% gain needed to clear an evaluation phase. When people say "profit target" in the context of a funded challenge, they almost always mean the account-level number. That's the one that matters for PT:DD.
Drawdown is the distance between your account's peak value and its lowest point after that peak, expressed as a percentage. The formula is straightforward: drawdown percent equals (peak minus trough) divided by peak, times 100. A $100,000 account that dips to $92,000 has taken an 8% drawdown. Maximum drawdown is simply the largest such dip over the evaluation period, and it's the number every firm caps.
Where it gets complicated is how firms measure that peak:
- Static drawdown anchors the limit to your starting balance. It never moves, so a $10,000 account with a 5% static drawdown fails at $9,500, period, regardless of how high your equity climbed in between.
- Trailing drawdown anchors to your high-water mark. Grow the account to $10,800 and a 5% trailing limit now sits at $10,260, ratcheting up with every new peak and never loosening.
- Balance-based drawdown locks the limit to your account balance rather than floating equity, which means open losing trades don't count against the limit until they're closed.
- Intraday drawdown tracks equity swings during the trading day, including trades still open.
- End-of-day (EOD) drawdown only checks the balance at close, ignoring how far underwater you went mid-session.
Two accounts with identical profit targets and identical drawdown percentages can have wildly different difficulty depending on which of these definitions the fine print uses.
Calculating the PT:DD Ratio and Required R Multiple
The PT:DD ratio, sometimes framed as profit-target-to-drawdown, is the cleanest single-number proxy for how hard a challenge will be to pass. The formula is:
PT:DD = Profit Target ÷ Maximum Drawdown
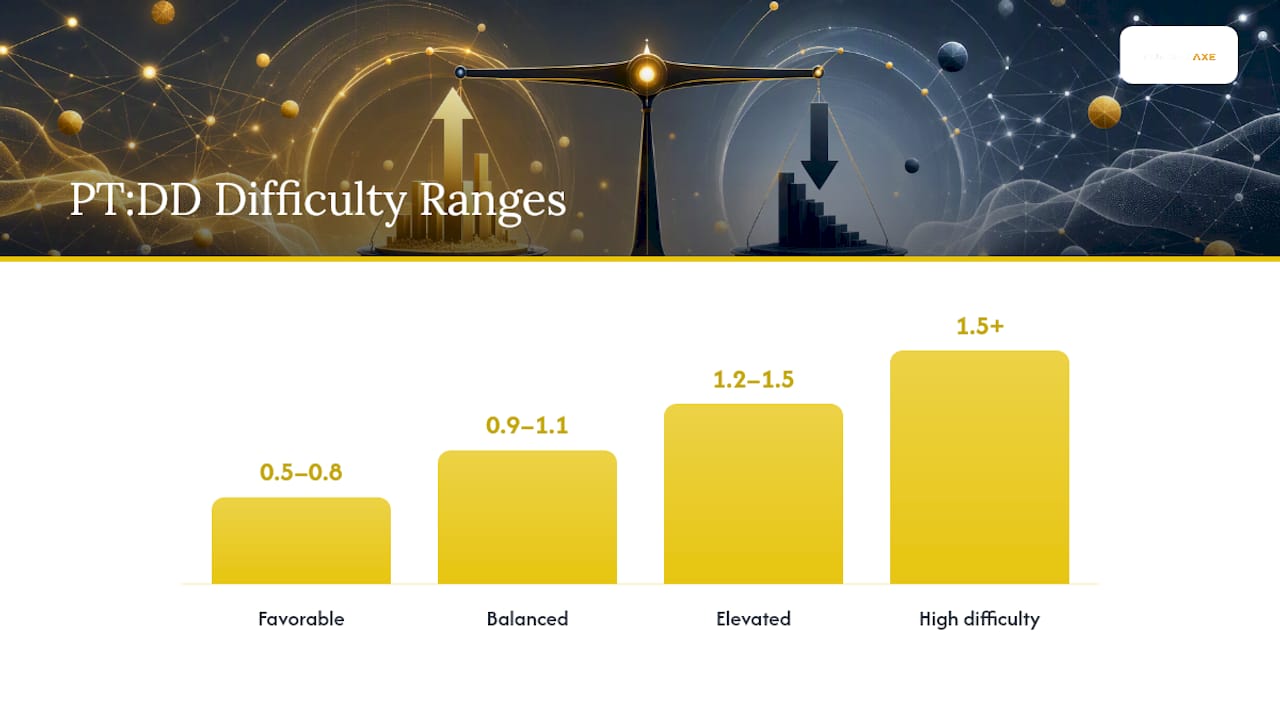
If a firm asks for an 8% gain and allows a 10% maximum drawdown, your ratio is 0.8. This ratio functions as a pass-difficulty proxy, and the accepted interpretation breaks down roughly like this: ratios near 1.0 are considered balanced, meaning the room to lose roughly matches the room needed to win. Ratios below about 0.8 tilt in the trader's favor mathematically, since you need less gain than the cushion you're given. Ratios above 1.5 tilt against you, demanding you outrun your own downside room by a wide margin.
| PT:DD Ratio | What It Implies | Trader Posture Needed |
|---|---|---|
| 0.5 – 0.8 | Favorable math, target well below drawdown room | Standard risk management usually suffices |
| 0.9 – 1.1 | Balanced, target and drawdown roughly matched | Requires disciplined position sizing |
| 1.2 – 1.5 | Elevated difficulty, less room for error | Needs a tested edge with consistent R multiples |
| 1.5+ | High difficulty, thin margin for losing streaks | Only suited to strategies with proven, repeatable payoff structure |
Pro Tip: Don't just eyeball the ratio. Run it against your own trading history. A 1.3 ratio might be trivial for a scalper with an 80% win rate and irrelevant risk-per-trade, but brutal for a swing trader who takes six trades a month.
The ratio connects directly to R-multiple thinking, which is how most systematic traders actually size their edge. An R multiple expresses a trade's result as a multiple of the initial risk. If you risk $200 and make $600, that's a 3R win. Divide your profit target by your maximum drawdown in dollar terms, and you get the required R multiple your system needs to deliver, on average, across the evaluation to clear the target before the drawdown catches you.
Say your account is $50,000, your target is $4,000 (8%), and your max drawdown is $2,500 (5%). Your PT:DD is 1.6. If your system risks $250 per trade, you need your winning trades to net roughly 1.6 times your average losing streak's damage just to break even against the drawdown ceiling, before you've made a cent toward the target. That's the real cost of a lopsided ratio: it's not abstract, it's baked into how many R multiples your edge has to produce, reliably, inside a fixed window of risk.
Recovery Factor and Calmar Ratio are worth knowing alongside PT:DD, since both relate total return to worst drawdown and can tell you whether a strategy's historical performance actually compensates for the downside it puts you through.
How Static vs Trailing Drawdown Changes the Real Difficulty
The same PT:DD number means two different things depending on drawdown implementation, and this is the detail most traders skip past.
A trailing drawdown is a moving floor calculated from your high-water mark, and it is structurally more restrictive than a static one at the same percentage. Give back $1,000 in a rough week and you're suddenly $650 from breach, even though your account is still up big overall.
Trailing rules also change trader behavior in a specific way: they encourage systematic profit-taking, because every new equity peak drags the floor up behind it. Traders often end up scaling out of winners earlier than they'd prefer, purely to lock in room before the trailing floor catches up.
Intraday vs EOD measurement shifts things again. An intraday drawdown rule tracks your equity in real time, including open positions, which means a trade that dips $800 underwater before recovering to close $200 in profit still registers that $800 swing against your limit. An EOD rule only checks your balance at close, so that same trade shows up as a $200 gain with no drawdown recorded at all. Firms using intraday tracking are, for practical purposes, giving you less real room than the stated percentage suggests.
When you're reading a firm's rule text, look for these specific phrases, because they determine your actual working room:
- Whether the drawdown is described as "static," "trailing," or "balance-based," each carries a different formula for where the floor sits.
- Whether losses are measured on floating equity or closed balance, since floating-equity rules punish open losing trades immediately.
- Whether the limit is checked intraday or only at end of day, which affects how much intrasession volatility you can absorb.
- Whether there's a minimum trading days requirement stacked on top of the drawdown rule, which can force pace changes late in an evaluation.
A firm offering static drawdown with balance-based, EOD calculation is giving you meaningfully more usable room than one offering the same percentage as trailing and intraday, even though the number on the page looks identical.
Using PT:DD to Judge a Prop Firm Evaluation
Once you know your ratio and your drawdown style, you can build a simple pass-difficulty proxy instead of guessing. Combine the raw PT:DD number with the style multiplier: treat trailing and intraday rules as effectively tightening your usable drawdown room, and static, EOD, balance-based rules as giving you the full stated percentage to work with.
Two quick comparisons show how much this shifts things:
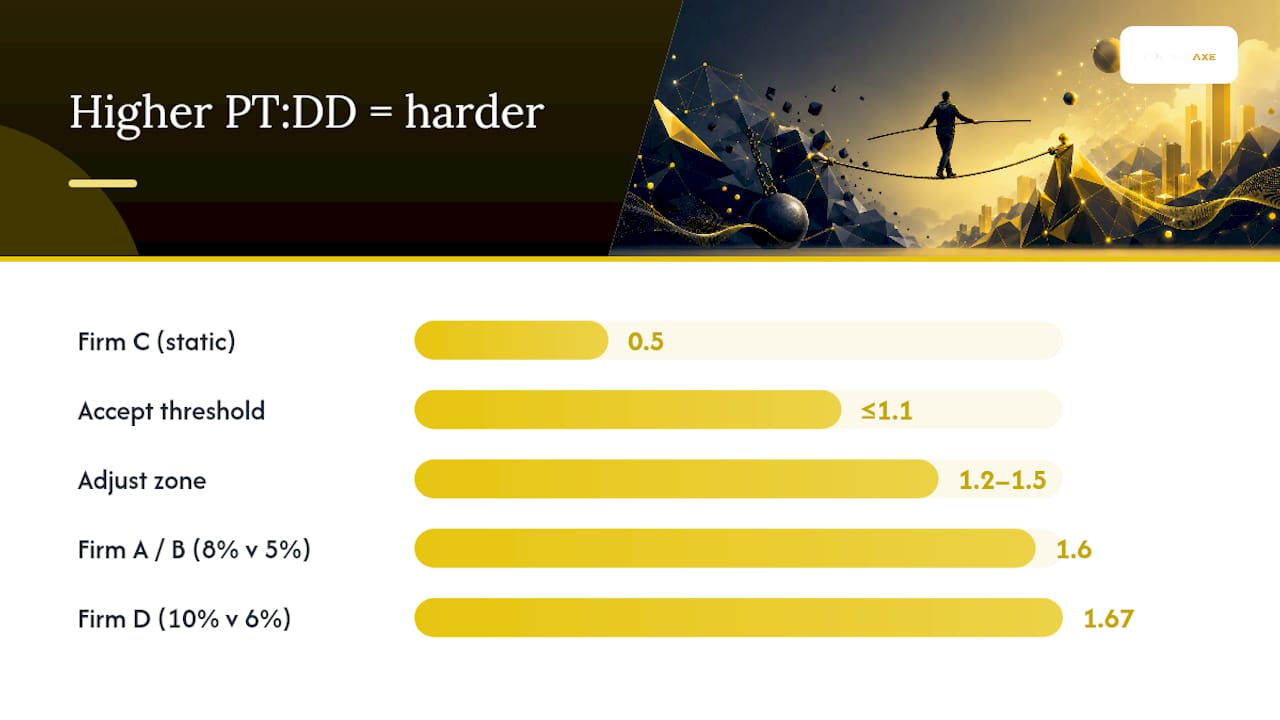
- Same ratio, different style. Firm A offers an 8% target against a 5% static, EOD drawdown, a 1.6 PT:DD ratio with the full 5% usable. Firm B offers the identical 8% target against a 5% trailing, intraday drawdown, the same 1.6 ratio on paper, but your effective usable room shrinks as your equity climbs, and intraday swings you'd otherwise ride out now count against you. Same math, different lived experience.
- Different ratio, same style. Firm C sets a 5% target against a 10% static drawdown, a 0.5 ratio that's mathematically forgiving. Firm D sets a 10% target against a 6% static drawdown, a 1.67 ratio that demands you nearly double your gain relative to your loss cushion under the exact same static, non-trailing structure.
From there, three decision rules cover most situations:
- Accept the terms when your PT:DD lands under 1.1 and the drawdown style is static or balance-based, meaning your historical win rate and average R multiple comfortably clear the required gain without needing an unusual hot streak.
- Adjust your plan when the ratio sits between 1.2 and 1.5, or the style is trailing or intraday, by tightening position sizing, trading fewer setups with higher conviction, and building in earlier partial profit-taking to protect against the moving floor.
- Skip the account when the ratio exceeds 1.5 combined with trailing, intraday measurement, unless your backtested system has a documented average R multiple that clears that bar with room to spare across a large enough sample to trust it.
A PT:DD calculator built for prop trading will spit out the raw ratio in seconds, but the style adjustment is the part you have to do yourself, because no calculator knows whether your particular firm trails the drawdown or holds it static. Understanding how account-size percentages interact with drawdown also matters here, since a 4% target on a large account can carry different practical weight than an 8% target on a small one.
A Step-by-Step Plan: Targets, Position Sizing, and Kill Switches
Pull three numbers from your trading history before you touch a live evaluation: your win rate, your average win size, your average loss size, and, critically, your worst historical losing streak measured in consecutive trades and total dollars lost. Most traders skip that last number and it's the one that actually predicts whether you'll survive a drawdown limit.
- Calculate your PT:DD and required R. Divide the account's profit target by its maximum drawdown in dollar terms. That gives you the R multiple your system needs to sustain, on average, to clear the target before hitting the ceiling.
- Set a realistic account target. If your backtested average R multiple falls short of what the ratio demands, either pick a smaller account size with a gentler target or accept you need a longer runway of trades to get there.
- Cap risk per trade against your worst streak. Take your worst historical losing streak and confirm that, at your planned risk-per-trade, it would not breach the drawdown limit. If five consecutive losses at 1% risk each would eat 5% and your drawdown cap is exactly 5%, you have zero margin, cut the per-trade risk further.
- Build a drawdown budget. Some traders formalize this by starting from the maximum tolerable drawdown and working backward into position size, rather than picking a risk percentage first and hoping it fits.
- Set operational stops. Define a daily loss stop (a hard dollar or percentage limit that ends your trading day), a session stop for volatile news windows, and a rule for scaling size up only after a defined number of winning trades, not a single lucky one.
Pro Tip: Set your stop threshold at roughly 1.2 to 1.5 times your worst historical drawdown, decided before you go live, not adjusted mid-evaluation when emotions are running the show.
A written plan that pins down these numbers in advance, rather than reacting to each day's equity swing, is what separates traders who survive an evaluation from those who blow it on a single bad session. Documenting this as an actual trading plan with these thresholds written down, not just remembered, makes it far easier to follow when a losing streak actually starts.
Worked Math: Recovery Percentages and Two Real Scenarios
The math behind drawdown recovery is asymmetric, and it's worse than most traders expect. The formula is required gain equals 1 divided by (1 minus drawdown), minus 1.
| Drawdown | Required Gain to Recover |
|---|---|
| 5% | 5% |
| 10% | 10% |
| 20% | 25% |
| 50% | 100% |
A 20% drawdown demands a 25% gain just to get back to even, not a 20% gain. Lose half your account and you need to double what's left. That asymmetry is exactly why limiting drawdown matters more than chasing bigger wins: the deeper the hole, the more disproportionately hard the climb out becomes.
Scenario A: intraday scalping against a trailing drawdown. A trader runs an account with defined trailing intraday drawdown and profit target percentages, resulting in a PT:DD ratio indicating elevated difficulty. Because the drawdown is trailing and intraday, every open trade's floating loss counts immediately, and the floor rises with each new peak.
Scenario B: swing trading against a static drawdown. A different trader runs the same account size and profit target but with a static drawdown measurement, resulting in a PT:DD ratio around 1.0, which indicates a balanced challenge. Because it's static, the floor never moves regardless of how high equity climbs, and because swing trades hold overnight, only the closing balance matters for most firms' EOD checks. This trader can absorb wider stops and hold through short-term volatility that would have triggered the intraday scalper's floor.
Build a simple spreadsheet with your account size, target percentage, drawdown percentage, and per-trade risk as inputs, then run the PT:DD and required-R formulas across two or three alternate drawdown percentages before committing capital.
Risk Controls and Platform Choices That Match the Math
Position sizing is the single most effective lever for controlling maximum drawdown exposure. Halving your risk per trade doesn't just halve your average loss, it substantially cuts the probability of hitting a peak drawdown at all, because fewer consecutive losses are needed to reach any given loss threshold.
Practical controls worth building into your routine:
- Cap risk per trade at a fixed percentage of current balance, recalculated after every closed trade, not the original balance.
- Keep a liquidity reserve of untraded capital as a buffer, since structural allocation controls tend to reduce drawdowns more reliably than trying to hedge your way out of a bad stretch.
- Set a hard daily loss stop that shuts down trading for the day, no exceptions, no "one more trade to get it back."
- Review your strategy's live performance against its backtested worst drawdown weekly, and pause trading if live losses start tracking meaningfully worse than backtest.
Some platform features materially affect which of these controls matter most. FundedAxe runs static, balance-based drawdown rather than trailing, which means the floor you calculated on day one stays put rather than climbing behind your equity, giving the position-sizing math above a stable target instead of a moving one. There's no time limit on any evaluation phase, so you're not forced to rush position sizing to hit a target before a clock runs out. The Pay After Pass structure lets you start an evaluation for $9.99 and pay the remaining challenge fee only once you've actually passed, which matters if you want to test a PT:DD-aligned sizing plan without committing full capital upfront. A free simulated $1,000 trial account, with no card and no deposit, is also useful for running the spreadsheet math from the previous section against real order execution before touching a paid evaluation. Expert Advisors and algorithmic trading are allowed, which matters if your position-sizing rules are coded rather than manual.
Pro Tip: Test your kill-switch rules on a trial account first. It's far cheaper to discover your daily stop is set too loose on a $1,000 simulated account than on a $100,000 funded one.
Common Mistakes and Emotional Traps Near the Target
Most blown evaluations happen within a few percentage points of either the profit target or the drawdown floor, exactly where emotion overrides plan. The errors repeat across nearly every account:
- Revenge trading after a loss, increasing size to "win it back" instead of following the pre-set risk-per-trade rule.
- Increasing position size after a winning streak, treating recent luck as evidence of a hot hand rather than sticking to the sizing math.
- Ignoring the daily loss stop because "the setup looks too good to pass up," which is exactly the rationalization the stop exists to prevent.
- Widening stops mid-trade to avoid taking a loss, which quietly increases drawdown exposure beyond what the original plan allowed.
When a losing streak starts eating into the drawdown cushion, a short checklist helps more than willpower: stop trading for the session, recheck the number of consecutive losses against your documented worst-case streak, confirm you're still inside your daily loss stop, and only re-enter the market at your next scheduled session, never immediately after a loss to "fix it."
Why Survival Beats Ambition Near the Target
The trade-off between an ambitious profit target and a tight drawdown limit isn't really a trade-off at all once you run the numbers. Recovery math is asymmetric: claw back from a big drawdown and you need a disproportionately larger gain just to get back to zero, let alone hit a target above it. Every trader who blows an evaluation chasing a target learns this the expensive way.
My rule is simple: size every position as if the drawdown limit is the real target and the profit target is a byproduct of surviving long enough to reach it. Test that assumption on a simulated account before a single dollar of challenge fee is at risk. If your sizing plan can't survive your own worst historical losing streak on paper, it won't survive it live either.
— Jean
Testing Your PT:DD Plan on FundedAxe
Running the PT:DD math on paper only gets you so far. You need to see how your position sizing actually holds up against real order execution and a real drawdown floor before a challenge fee is on the line. Fundedaxe's static, balance-based drawdown gives you a fixed floor to plan against instead of a trailing target that moves every time you win, and there's no time limit on any evaluation phase, so your sizing decisions don't get rushed by a clock.

Start with the free simulated $1,000 trial account, no card, no deposit, and run the position-sizing and kill-switch rules from this article against live pricing before committing to a paid evaluation. If the plan holds up, Pay After Pass lets you begin a real evaluation for $9.99 and pay the remaining fee only once you've actually passed, and Expert Advisors are allowed if your sizing rules run through code. Check current account sizes and evaluation options to match a challenge to the PT:DD ratio your own trading history can realistically clear.
This article is general information, not a substitute for advice from a qualified financial advisor. Consult a qualified financial professional about your own circumstances before acting on anything here.
Sources
- Drawdown in Trading: The Definitive Guide to Measuring and Managing Pain 2026
- Profit Target To Drawdown Ratio 2026: Master Prop Trading Risks
- Navigating the Moving Target: A Trader’s Deep Dive into Trailing Drawdown
- Profit Target to Drawdown Ratio Calculator | PropFirmCorner